- cfd
- combustion
H₂/CH₄ Co-injection in Blast-Furnace Tuyeres
A reacting-flow CFD and design-of-experiments study of hydrogen and methane co-injection with pulverised coal — how far tuyere CO₂ intensity can fall before the material limit stops you
datasheet // decarbonisation-tuyeres
- images
- 9
- videos
- 0
- formats
- png
- text
- 673 words · 4 min read
- studio
- /molecules?preset=8
- source
- previous site
- topics
-
- geometry ×4
- mesh ×2
- experimental rig ×1
- decarbonisation results ×2
On this page0%
Problem
Blast-furnace ironmaking is one of the hardest industrial sectors to decarbonise — the furnace itself is a decades-long capital asset, so a retrofit path that doesn’t require replacing it is worth far more than a clean-sheet redesign. One such path is at the tuyeres: partially substituting the pulverised coal injected there with hydrogen or methane, both of which already have supply infrastructure most steel plants can access. The open question this course project asked was simple to state and hard to answer: how much substitution actually lowers CO2 intensity, and what stops you from pushing it further?
Approach
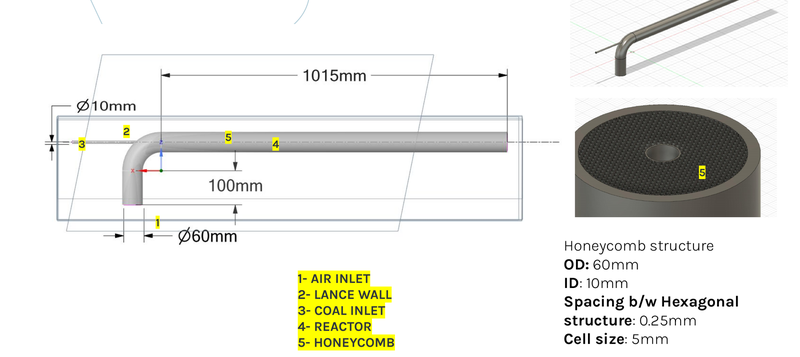
A team of six (Team F: Krunal, Davis, Gautham, Pavithra, Jayavishvaa, Chandu) built a reacting-flow CFD model of a pulverised-coal-injection (PCI) tuyere in ANSYS Fluent, based on a real rig geometry (lance, ceramic-honeycomb flow straightener, preheating section, combustor). My scope was the base-case tuyere dynamics — the 2D axisymmetric reacting-flow setup and its grid-convergence study — and the experimental design of experiments, shared with one teammate on the base case and with the whole team on the DOE.
The base case ran at O/C 1.5, 1473 K blast temperature, 4.5 atm, 20 kg/h coal and 84 Nm3/h air with 8.5% O2 enrichment, modelled at two lance diameters (15 mm and 25 mm) to see how lance geometry shifts where devolatilisation starts. H2 and CH4 co-injection was then added at substitution levels from 10% to 80% of the base case’s power rating, sized by matching thermal input against each fuel’s calorific value and combustion stoichiometry — the same calculation this page’s CO2-intensity chart is built from. A separate 3D cold-flow model, including the ceramic-honeycomb section, was built to check the flow field ahead of attempting a flame-anchoring study.
Results
CO2 intensity fell substantially with substitution — from 0.121 g CO2/kJ for coal alone to 0.091 g CO2/kJ at 80% (by power rating) CH4 substitution, and 0.067 g CO2/kJ at 80% H2 substitution: a 45% reduction on hydrogen.
But that number isn’t the whole story, and the more useful finding is the constraint it ran into. Peak flame temperature exceeded the 2400 K allowable limit for tuyere materials in almost every case studied — 3100 K and 2700 K for the 15 mm and 25 mm base cases respectively, 3040 K at 10% CH4, and as high as 4500 K at just 10% H2 (settling to 3550 K by 80% H2, since a larger fraction of a cooler overall mixture moderates the peak). Hydrogen combusts almost instantaneously at the lance — devolatilisation of coal particles happens right at the inlet rather than downstream — and drives CO production up as H2 increases. Increasing CH4 instead pushes the devolatilisation zone further downstream and raises CO more gradually. The practical conclusion: the substitution ceiling here is set by tuyere materials, not by combustion chemistry — a real design constraint for anyone taking this path, not a reason to dismiss it.
Limitations
Stated plainly, not buried: the 3D cold-flow simulations did not converge, and those results are not reported on this page — the source deck itself is explicit about this (pressure and turbulence-intensity fields reached non-physical magnitudes). Meshing the honeycomb geometry in 3D proved difficult enough that the planned flame-anchoring study was dropped in favour of the cold-flow case alone. This was coursework-scale CFD over one semester, not a validated production model — the CO2-intensity and peak-temperature results above come from the 2D reacting-flow cases and stated stoichiometry, which is why they’re the results shown here.
My contribution
Course project, Decarbonisation Technology, IIT Madras, Aug–Dec 2022 — done alongside my PhD, not as PhD research. Team of six; my scope was the base-case tuyere dynamics (2D reacting-flow setup and grid-convergence study, with one teammate) and the experimental design of experiments (with the full team).
What this enables
The one item in my record that speaks to industrial decarbonisation by name — a small but concrete data point on where hydrogen co-injection helps a hard-to-abate sector, and where its own combustion physics pushes back against the equipment carrying it.