All projects

  • sciml
  • education

vZero explainer

Charts, diagrams and a slide deck explaining Neural ODEs for stiff chemistry, with toy experiments
34 images · 1 min read

vZero explainer

datasheet // vzero-explainer

images
34
videos
0
formats
png, pdf
text
89 words · 1 min read
topics
  • charts ×15
  • diagrams ×19

Datasheet

  • Deck: 35 slides (vZero Neural ODE), source slides.json; the shipped PDF has 34 slides (slide 31 removed)
  • Guide: 39 pages in the source; the shipped PDF has 37 pages
  • Sections (slides.json): The Map, The Core, Numerics, Training, Gradients, Representation, Koopman and Reduction, Physics and Measurements, Validation, Deployment, The Next Experiment, Recap
  • Figures: 15 charts (vector PDF rendered at 2400 px) and 19 slide diagrams
  • Also shipped: an interactive power-mean explorer (self-contained HTML)
  • Content type: teaching toy experiments; no H2/air accuracy, chemical speed-up or deployed INT8 results are claimed
Slide 7 chart: A complete small learning loop Explain Playground
Slide 8 chart: Test a rollout beyond the training window Explain Playground
Slide 9 chart: Stiffness means competing clocks Explain Playground
Slide 10 chart: The solver is part of the model you run Explain Playground
Slide 11 chart: Normalize the microphones Explain Playground
Slide 12 chart: Loud loss is not loud gradient Explain Playground
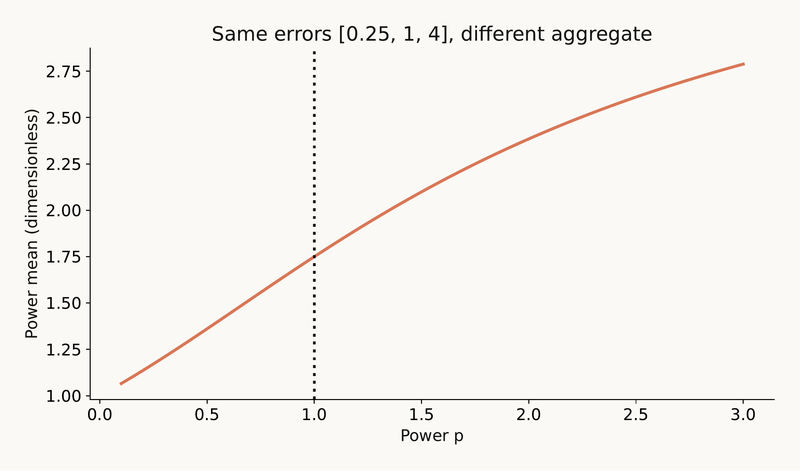
Slide 13 chart: The power mean is an emphasis knob Explain Playground
Slide 14 chart: The landscape is over network weights Explain Playground
Slide 17 chart: Change the coordinates, keep track of the meaning Explain Playground
Slide 19 chart: Log transforms need a boundary policy Explain Playground
Slide 21 chart: One extra observable closes this toy Explain Playground
Slide 22 chart: DMD fits a linear step from snapshots Explain Playground
Slide 23 chart: POD compresses snapshots Explain Playground
Slide 25 chart: A robot arm makes state and rate tangible Explain Playground
Slide 32 chart: Quantization is controlled rounding Explain Playground
Slide 1 diagram: vZero Neural ODE Explain Playground
Slide 2 diagram: Five jobs, five different questions Explain Playground
Slide 3 diagram: A state is a snapshot Explain Playground
Slide 4 diagram: A rate is not the next state Explain Playground
Slide 5 diagram: What does the neural network learn? Explain Playground
Slide 6 diagram: Where this appears in vZero Explain Playground
Slide 15 diagram: Forward prediction and backward credit Explain Playground
Slide 16 diagram: Check the gradient on a problem you can solve Explain Playground
Slide 18 diagram: A new map does not erase every fast clock Explain Playground
Slide 20 diagram: Koopman changes what we observe Explain Playground
Slide 24 diagram: A latent Neural ODE adds a learned evolution Explain Playground
Slide 26 diagram: Build a valid mechanical mass matrix Explain Playground
Slide 27 diagram: Use constraints that match the domain Explain Playground
Slide 28 diagram: A graph tells the model who interacts Explain Playground
Slide 29 diagram: A camera sees an observation of the state Explain Playground
Slide 30 diagram: A progress coordinate is not a clock Explain Playground
Slide 33 diagram: ONNX carries a computation graph Explain Playground
Slide 34 diagram: Change one layer, keep the comparison honest Explain Playground
Slide 35 diagram: Learn the rate. Respect the solver. Check the physics. Explain Playground

Documents